Setup Jupyter Lab with Plotly

This article will show you how to setup Jupyter Lab and install some Python Packages for Data Analysis and Data Visualization work.
Setup Python Environment
First of all, you should have a Python and PIP package in you local machine. You have many ways to do that. I will show you some popular ways.
Install via Advanced package tool - APT (Ubuntu)
- Open you terminal
- Run bellow command
1
2
3
4
5
6
# install python and PIP
sudo apt install python3-dev python3-pip
# check version of python
python3 --version
# check version of pip
pip --version
Install Anaconda or Miniconda (recommend for MacOS and Ubuntu)
This way might have more complicate than above but it will give you more flexible setup python environment. In this article, I will use miniconda to setup the Python environment. Also Im using MacOS.
1
2
3
4
5
6
7
8
9
# Install miniconda
mkdir -p ~/miniconda3
curl https://repo.anaconda.com/miniconda/Miniconda3-latest-MacOSX-arm64.sh -o ~/miniconda3/miniconda.sh
bash ~/miniconda3/miniconda.sh -b -u -p ~/miniconda3
rm -rf ~/miniconda3/miniconda.sh
# after installing, initialize your newly-installed Miniconda.
# the following commands initialize for bash and zsh shells:
conda init bash
conda init zsh
Setup and run Jupyter Lab
Create local environments that manage the libraries installed for each environment separately, making them easy to create or delete.
1
2
3
4
5
6
# create `jupyter_plot` environment
conda create -n jupyter_plot python=3.9 jupyterlab plotly pandas
# activate `jupyter_plot`
conda activate jupyter_plot
# run the jupyter lab
jupyter lab
Test the Jupyter Lab with some plot
You can create a new notebook and paste the bellow code to check the result
1
2
3
4
import plotly.express as px
data_canada = px.data.gapminder().query("country == 'Canada'")
fig = px.bar(data_canada, x='year', y='pop')
fig.show()
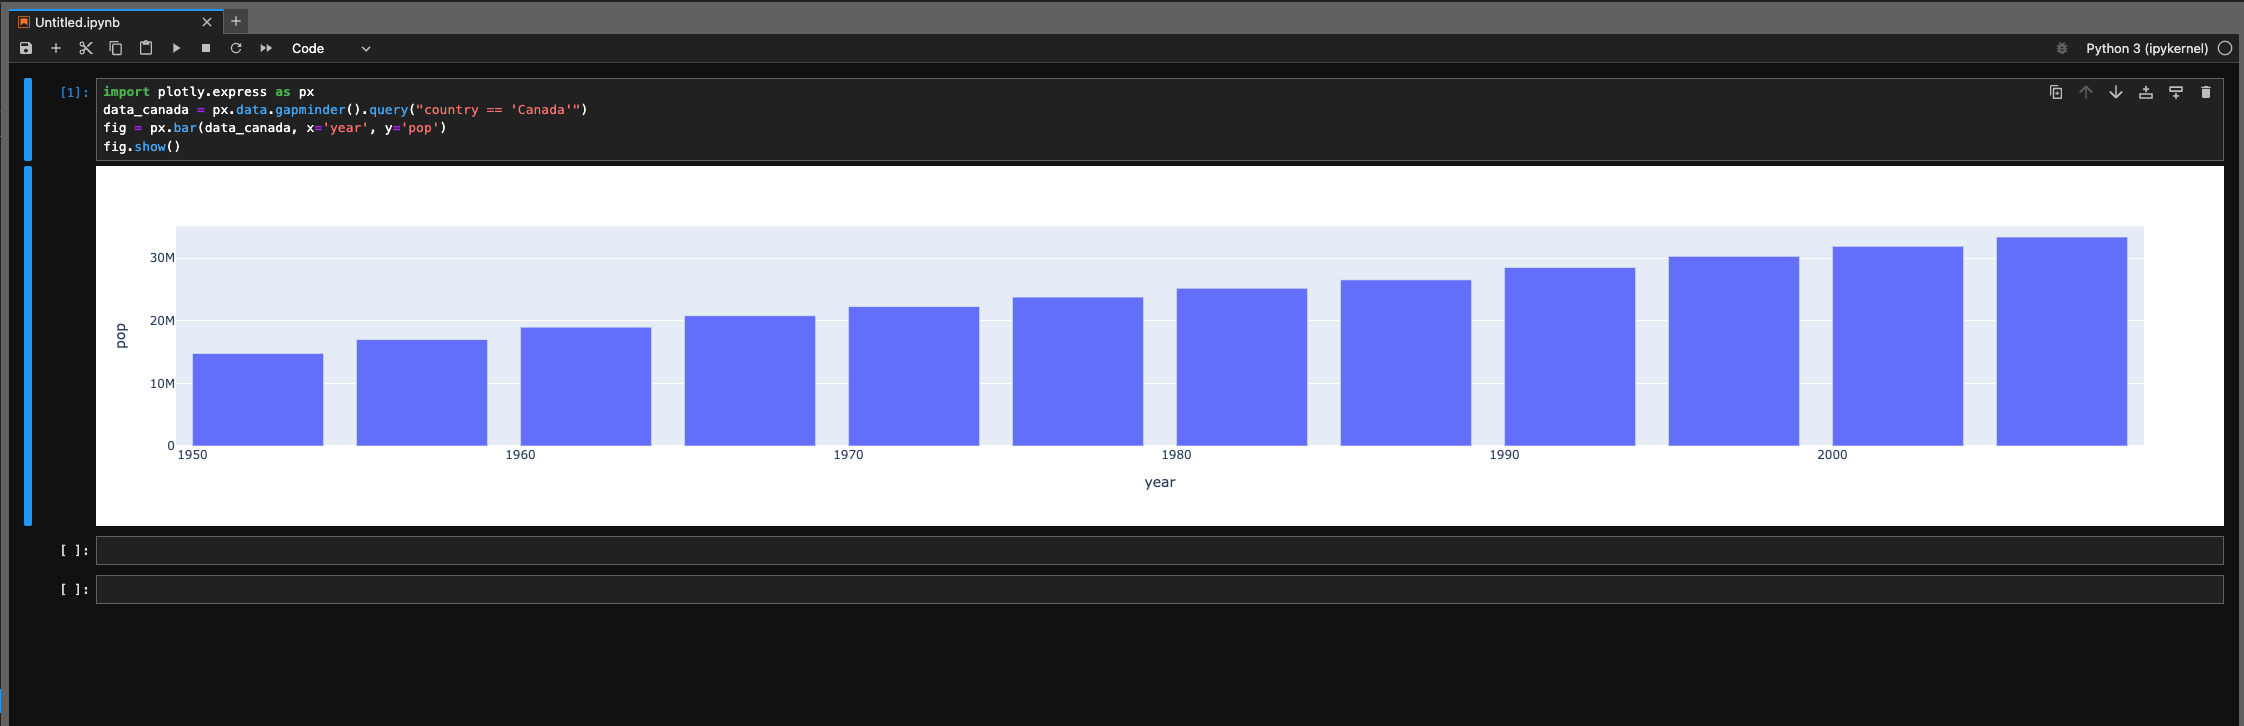 Example Bar Plot
You can find a lot of basic charts from Plotly Basic Charts
Extra: Running Jupyter Lab with Docker
Docker is a platform designed to help developers build, share, and run container applications. So we can easily to setup and deploy the application. You can follow my Dockerfile and use bellow docker-compose.yaml
1
2
3
4
5
6
7
8
9
10
11
12
version: "3"

services:
  jlab:
    image: your_image_name
    build:
      context: jupyter-lab
    container_name: jlab
    expose:
      - 8888
    restart: always
    command: jupyter lab --no-browser --LabApp.password='sha256:{SHA-PASSWORD}' --LabApp.allow_remote_access='True' --LabApp.allow_origin='*'
You can use bellow code to generate SHA-PASSWORD for Jupyter
1
2
3
4
5
6
7
from notebook.auth import passwd

my_password = "my-password"

hashed_password = passwd(passphrase=my_password, algorithm='sha256')

print(hashed_password)
Conclusion
In this tutorial, you configured Jupyter Lab and Plotly. You are now ready to perform some analysis and visualization work with your data.
References
Here are a couple other articles that were helpful in getting the Jupyter Lab tutorial: